Realtime Charts for Torque Pro
- 4.2
- Rating
- 10.00K
- Installs
- $2.49
- Price
 Analysis by App-foxy
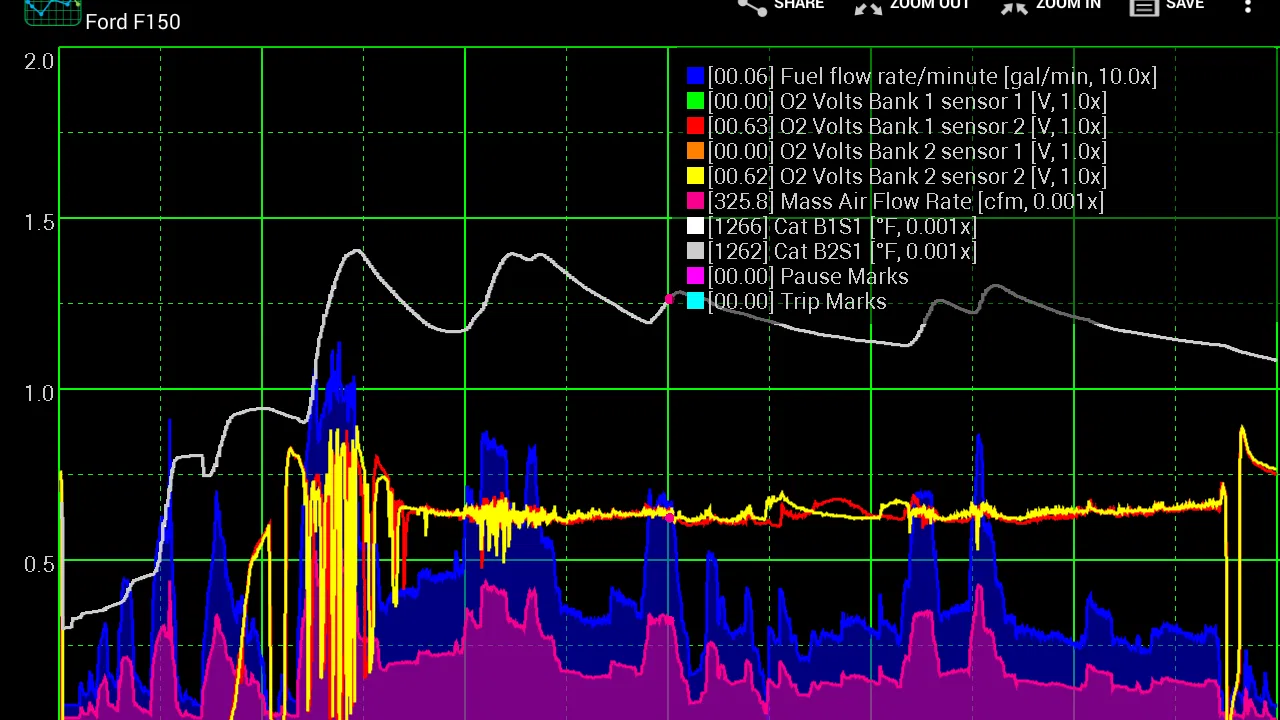
When I want a clearer view of what my car is doing, I would rather see several live readings together than keep switching between separate screens. That is the basic appeal of Realtime Charts for Torque Pro: it adds a chart-focused view to the Torque Pro OBD 2 & Car app instead of trying to replace the main diagnostic tool. I see it as a companion for drivers who already use Torque Pro and want to watch changing vehicle data in a more visual way.
This is an Android app in the Auto & Vehicles category, developed by Crystal Lake Apps LLC. It costs $2.49, carries an Everyone age rating, and has reached over ten thousand installs. Its average rating is 4.2 from around 377 ratings, with roughly 71 written reviews. Those numbers suggest a small but established utility rather than a mainstream dashboard app, and that distinction matters: its usefulness depends heavily on already having Torque Pro and a compatible OBD setup.
How Realtime Charts fits into a Torque Pro setup
I find it helps to think of Realtime Charts as one part of a shared car-monitoring setup, not as a separate household dashboard. This section looks at where the plugin fits alongside Torque Pro, an OBD connection, and the people who may use the same vehicle, before considering how to keep those roles clear.
You May Also Like

 Blood Strike: 2.5 Anniversary
Blood Strike’s Loadouts Turn Every Drop Into a Tactical Gamble
A close look at Blood Strike’s custom loadouts: how fast access to signature weapons reshapes its battle royale rhythm, rewards preparation, and narrows the gap between fights.
 Pandora - Music & Podcasts
Pandora’s Music Is Easy to Start, but Harder to Recover
Pandora’s strength is its low-effort path from a seed to a station. Its weak spot is how much confidence it asks you to place in connection, setup, and quiet recovery.

 8 Ball Pool
 Is Built on Rivalries, Rematches, and Routine
A close look at the rivalries, rematches, shared routines, and unanswered safety questions that turn a quick pool match into a persistent mobile community.

 Samsung Music
’s Quiet Strength Is Playing What You Already Own
Its reach comes less from spectacle than from dependable access to a personal library. That simplicity is both the app’s strongest retention engine and its ceiling.

 AccuWeather: Weather Radar
AccuWeather Review: A Quick, Clear Forecast for Everyday Decisions
For everyday plans, the best forecast is the one you can understand quickly. AccuWeather makes rain timing, radar, and local conditions easy to act on, with a few trade-offs.

 Hill Climb Racing
Why Hill Climb Racing Still Turns Crashes Into One More Run
A tiny car, a bumpy hill and one more upgrade: Hill Climb Racing keeps resurfacing because its simple chaos makes every near-miss feel personal.
More From Our News Desk



A focused add-on rather than a standalone car scanner
The first thing I would clarify to a friend is that this is a plugin. The store summary identifies it as a plugin for Torque Pro, so installing it alone is not the same as installing a complete OBD reader. You need the Torque Pro environment to make sense of it, along with the vehicle connection and adapter that supply the live information.
That narrow purpose is both its strength and its biggest limitation. Because the app is designed around Torque Pro, it can concentrate on displaying changing values in chart form instead of becoming another general-purpose maintenance app. On the other hand, someone looking for a simple plug-in-and-go dashboard may find the setup more involved than expected.
I like this approach when I am trying to understand behavior over time. A single live number can be misleading: a reading may rise briefly, settle, and then change again as the engine warms or the car moves under load. A chart gives that movement some context. It is especially useful when I am checking whether a value is stable, fluctuating, or reacting to a specific driving condition.
What the visual format adds
Realtime Charts is most convincing when the question is not “What is the value right now?” but “How did this value get here?” That difference is easy to overlook. A regular numeric gauge is excellent for a quick glance, while a plotted line can reveal a pattern that disappears between glances.
For example, I could use a chart while the car is warming up, then compare the behavior during steady cruising and gentle acceleration. I would not treat the graph as a professional workshop instrument, but it can help me notice relationships and decide whether a symptom is repeatable enough to investigate further.
Another practical use is recording a short observation during an ordinary trip. If the car feels hesitant only on an incline, watching a live chart during that situation may be more informative than checking the same reading while parked. This does require planning: I would configure the display before driving and avoid handling the phone in motion.
Installation and first-use expectations
The app was released on February 17, 2016, and the current version is 1.70. It supports Android from version 4.0 onward, which makes it compatible with older hardware than many modern automotive utilities. That broad system requirement is helpful if you have a spare older phone for the car, although an old operating system does not automatically guarantee a smooth experience with every current adapter or Torque Pro setup.
I would install Torque Pro first, confirm that the OBD connection works, and only then add the chart plugin. This order makes troubleshooting much easier. If live values are not appearing, there are several possible causes: the adapter, the vehicle connection, Torque Pro, the selected data item, or the plugin itself. Testing the underlying app before adding another layer prevents needless guesswork.
It is also worth deciding what I am trying to observe before opening the chart screen. A chart with too many unrelated values can become visually busy and make the useful signal harder to recognize. Starting with a small set of readings gives each line a purpose and makes a short test drive easier to interpret.
Everyday scenarios where it earns its place
One realistic scenario is a warning light that appears intermittently but disappears before I reach a garage. I could use Torque Pro and the chart view to observe relevant live data during the conditions that seem to trigger the problem. That would not diagnose the fault by itself, but it could give a mechanic a more useful description than “the car felt strange once.”
A second scenario is checking a used car during a viewing. I would not treat this plugin as a substitute for a professional inspection, yet a compatible OBD setup can add another layer of information during a drive. Watching how readings behave at idle, during acceleration, and after the engine reaches normal temperature may help me ask better questions before buying.
A third use is learning. If I am curious about how engine readings change between city traffic and open-road cruising, the charts turn an invisible process into something I can observe. That educational value is easy to underestimate. It can make Torque Pro feel less like a collection of numbers and more like a tool for understanding the car’s behavior.
What existing Torque Pro users gain
For someone already comfortable with Torque Pro, the plugin can make live monitoring more analytical. Instead of checking a value, dismissing it, and trying to remember what it was a moment ago, I can follow its direction and timing. That is the main improvement I would expect from adding it to an established setup.
It may also reduce the temptation to install a completely separate vehicle-monitoring app. Keeping the chart function within the Torque Pro workflow can be simpler than maintaining another app with its own interface and connection process. The trade-off is that the benefit is limited if I rarely use live data or prefer a basic dashboard.
Existing users should also keep expectations realistic when updating. Version 1.70 is the current version, but the version number alone does not tell me that the app has recently received a major redesign or a particular new function. I would view it as the current maintained form of a long-running plugin, not assume that every release changes the way it works.
Where the experience can become frustrating
The biggest friction comes from dependency. Realtime Charts is not an independent OBD solution, so a person who does not already own Torque Pro has to account for that extra requirement. There is also the usual need for a compatible OBD adapter and a vehicle that exposes useful data through the connection. The plugin cannot create readings that the rest of the setup does not provide.
There is a learning curve as well. A moving line looks informative, but interpreting it correctly requires some knowledge of what the selected reading represents and under which conditions it should change. A sudden movement is not automatically a fault, and a flat line is not automatically proof that everything is healthy. I would use the charts to identify patterns, not to make unsupported mechanical conclusions.
Phone placement is another practical concern. A chart is only useful if I can see it without taking attention away from the road. I would mount the phone securely, configure the screen while parked, and use a passenger for observation during a test. This is not an app-specific defect, but the visual nature of the plugin makes safe setup especially important.
How it compares with ordinary alternatives
The usual alternative is a standard numeric dashboard inside Torque Pro. That option is better when I need a quick glance at one or two values, such as during a short drive or a basic check. Numbers are compact, familiar, and often easier to read at a glance than several plotted lines.
A dedicated professional scan tool is the better choice for workshop-level diagnosis, manufacturer-specific information, service procedures, or a formal inspection. Realtime Charts should not be confused with that class of equipment. Its advantage is accessibility and visual trend monitoring, not complete diagnostic authority.
There are also general car apps that combine trip tracking, fuel records, reminders, and alerts. Those may be a better fit for someone whose priority is ownership management rather than live technical observation. This plugin makes more sense when the central task is watching OBD data change through Torque Pro.
In my view, the most sensible comparison is not “Which app has the most features?” but “What kind of question am I asking?” If I want a trend, this chart-based add-on has a clear reason to exist. If I want maintenance reminders, navigation, fuel logging, or a polished all-in-one dashboard, I would choose something else.
Small workflow choices that improve the results
I would begin every investigation with a repeatable route or condition. If I compare an idle reading one day with a hill climb another day, the difference may come from the situation rather than the car. Repeating the same short drive, with similar engine temperature and driving style, makes the chart easier to judge.
I would also change only one variable at a time. If I alter the route, driving style, and selected readings together, the chart may show movement without explaining why. A simple sequence—warm the car, observe at idle, drive steadily, then apply a controlled load—can produce a more useful picture than an unplanned drive full of changing conditions.
A less obvious benefit of this approach is that it helps separate a persistent pattern from a momentary impression. Drivers often remember the instant a car hesitated but forget what happened immediately before it. A chart can provide a timeline for the observation, provided I treat it as supporting evidence rather than a final diagnosis.
I would avoid building a display that tries to show everything at once. More lines do not necessarily mean more information. A focused chart for the question at hand is easier to read, easier to explain to a mechanic, and less distracting in the vehicle. Once I understand one relationship, I can add another reading if it genuinely helps.
Who should install it, and who should skip it
I would recommend it to a Torque Pro user who enjoys checking live vehicle data, investigating an intermittent symptom, or learning how readings respond to different driving conditions. It is also a reasonable low-cost addition for someone who already has the required setup and specifically wants a visual history of changing values rather than isolated numbers.
I would skip it if I expect a standalone scanner, a complete repair diagnosis, or a polished vehicle-management suite. I would also skip it if I rarely connect to the car or find technical readings more confusing than useful. Paying for a plugin does not make sense when the underlying Torque Pro workflow is not part of my regular driving routine.
The price of $2.49 is modest, but the real cost is the surrounding setup and the time needed to learn what I am viewing. For an existing Torque Pro owner, that can be a sensible exchange. For a newcomer starting from zero, the plugin is only one piece of a larger process, so I would decide based on the entire setup rather than the app price alone.
What I would watch in its current state
The current version, 1.70, is the version I would evaluate before installing, especially on an older Android phone. Since the app has been available since 2016, its continued usefulness depends less on novelty and more on whether it remains comfortable within the Torque Pro workflow and the particular phone-and-adapter combination I use.
I would pay attention to three things after installation: whether the plugin appears correctly inside Torque Pro, whether the selected readings update consistently, and whether the chart remains readable in the phone’s mounted position. These checks answer the practical questions that matter more than a feature list. If all three work, the add-on is doing its job.
I would also keep an eye on how well it fits newer driving habits and hardware. Support for Android 4.0 is useful for older devices, but compatibility in an actual car depends on the whole chain, including the phone, Torque Pro, adapter, and vehicle. A careful test while parked is the best way to find out before relying on it during a trip.
My final take on the plugin
Realtime Charts for Torque Pro is a specialized tool with a clear purpose. I would not describe it as an all-purpose car app, and I would not buy it expecting professional diagnostic coverage. Its value comes from showing live Torque Pro information as changing patterns, which can make intermittent behavior and warm-up or load-related changes easier to understand.
For me, the decision is straightforward: if I already use Torque Pro and want trend-focused monitoring, the $2.49 purchase is easy to justify. If I only want a quick dashboard or have no interest in interpreting OBD readings, the plugin adds complexity without solving a real problem. It is a practical companion for curious and hands-on drivers, provided they understand the limits of charts and use them as evidence for better questions—not as a replacement for proper mechanical diagnosis.
FAQs for Realtime Charts for Torque Pro
01What is Realtime Charts for Torque Pro used for?
Realtime Charts for Torque Pro is an add-on designed to display live vehicle data collected through the Torque Pro OBD2 app. It can turn readings such as engine speed, coolant temperature, intake pressure, fuel-related information, and other sensor values into customizable charts. This makes it easier to observe changes while driving, diagnosing a problem, or testing how the vehicle behaves under different conditions.
02Does Realtime Charts for Torque Pro work without Torque Pro or an OBD2 adapter?
No. Realtime Charts for Torque Pro is intended to work alongside Torque Pro, so installing the add-on alone is not enough to read vehicle information. You generally need Torque Pro installed on a compatible Android device, plus a supported Bluetooth or Wi-Fi OBD2 adapter connected to the car. Compatibility can also depend on the vehicle, available sensors, and the quality of the adapter.
03What kind of vehicle information can be shown in the charts?
The available information depends on the data provided by Torque Pro and the vehicle’s onboard computer. Users may be able to chart parameters such as RPM, speed, coolant temperature, throttle position, engine load, intake air temperature, fuel trims, boost pressure, and various diagnostic readings. Not every car exposes the same sensors, and some values may be estimated rather than directly measured.
04Can I customize the charts and monitor several values at once?
The main appeal of Realtime Charts for Torque Pro is its focus on visualizing live readings in a more understandable way. Depending on the version and device, users can typically select the parameters they want to follow, adjust chart displays, and compare changing values while the vehicle is running. However, the experience may vary with screen size, phone performance, and the number of data streams displayed simultaneously.
05Is Realtime Charts for Torque Pro safe and easy to use while driving?
The application itself does not control the vehicle, but viewing live charts while driving can still be distracting. It is best to configure the display before starting a trip and have a passenger monitor the readings whenever possible. Drivers should never handle the phone while moving. For troubleshooting or performance testing, use the app while parked or in a controlled, legal environment, and remember that its readings should not replace professional diagnostics.
Pros
- Displays live vehicle data in easy-to-read charts.
- Supports multiple sensor values at the same time.
- Useful for spotting changes during test drives.
- Works as a practical Torque Pro companion tool.
- Chart views can make technical data easier to understand.
Cons
- Requires Torque Pro and a compatible OBD2 adapter.
- Available data depends on your vehicle’s supported sensors.
- May increase battery use during extended monitoring.
- Charts can feel overwhelming for users new to diagnostics.
- Not intended to replace professional diagnostic equipment.

Realtime Charts for Torque Pro
Gallery